9. Interpretation Process
Objective:
At the end of this section the user will know how to approach the task of report interpretation
Interpretation
The following section will give some general guidance on how to interpret the Standard report. If you would like to review the different parameters once more before you continue with this section, please return to Chapters 4 and 5 in this course.
Just a reminder that QbTest reports should only be used as a part of a comprehensive assessment in conjunction with other clinical data and should only be interpreted/used by people who have undergone formal training by Qbtech.
Before you start your interpretation, always ensure that you have a copy of the Behaviour Observation form as this will provide essential information about anything that occurred during the test.
General guidance to the Standard report
We recommend that you always start your interpretation by looking at the Standard report as this is where you can get a good overview of the test taker’s performance.
Remember to initially look at the pattern of the graphs as this gives the interpreter a feel for how the test taker has approached the task and how their strategy or performance may have changed over the duration of the test.
Only after you have examined the graphs should you turn to the actual scores in the parameter summary. It is beneficial to have a methodical approach to interpretation and to take time to look at each different area of the report as below:
1) Area graph
First look at the Area graph and the 4 crosses representing each quartile of the test. What type of activity do you see? Is there a tight black knot in the middle of the cross, suggesting small fidgety movements, or are you seeing big squiggles, where the line travels away from the center of the cross, suggesting larger, more vivid movement patterns?
Perhaps there is a combination of large and small movements represented by a small dark area close to the centre of the cross, as well as some larger loops. Does the amount of activity appear to increase over time, or is it constant throughout the test? Perhaps activity is initially high but decreases over the duration of the test.
How do the movement patterns and changes seen on the Standard report correspond with any comments on the Behaviour Observation Form?
2) Distance graph
Next, look at the Distance graph – once again look for changes in the level of activity over the duration of the test. Does it increase, decrease, or remain constant? Are there any anomalies that stand out? You may find these either in the Distance graph or in the Area graph, such as sudden big bursts of activity or lack of activity during intervals of the test time. Once again, it is important to cross reference any anomalies with comments on the Behaviour Observation form.
A sudden large movement might relate to the patient having dropped the responder button on the floor and then bending down to retrieve it.
3) Attention and impulsivity graph
Once you have examined the two Activity graphs you can move on to the Attention and Impulse Control graph. Start by looking at the first few minutes of the test – are there more correct (green circles) than incorrect (red squares, or black lines of Omission or Anticipations) responses? If not, it is possible that the test taker did not understand the task.
However, it is also possible that the test taker is so impulsive and/or inattentive that they failed to execute the task properly due to the level of their impairment. Referring to the Behaviour Observation form at this point can be very helpful for ascertaining whether the patient may have had difficulty in understanding.
The Administrator is trained to ensure that the patient fully understands the task prior to beginning QbTest. However, sometimes this may not be apparent initially and so it is still the responsibility of the Interpreter to confirm this on the report.
It is important to remember that if the patient has not fully understood what they are required to do, the test results will not be valid. If you are unsure, you can always book an interpretation support call with one of our Clinical Advisors to discuss the report.
Once you are satisfied that the patient has understood the task, examine how their pattern of response changes over time. Do they improve or deteriorate? An improvement may suggest initial anxiety that settles, or they may have received a prompt to help redirect them to task – again this information should be verified with the Behaviour Observation form.
A deterioration is suggestive of an inability to sustain attention over time, but you can also look for other clues. Were they trying to engage the administrator in conversation? Were they becoming increasingly restless? Were they zoning out or had they disengaged?
Look at correct vs. incorrect responses. Do they make more errors as time passes or do they improve? Are there more commission errors at the start of the test, but more omission errors at the end or is the pattern of errors consistent throughout the test?
What about the speed of their responses? Remember, the further down the y-axis that responses (green circles and red squares) are plotted on the graph, the faster their response time. Do their responses start off quick and consistent, but become slower and more varied as the test progresses?
Always look for any clues on the Behaviour Observation Form that might explain a particular pattern. For example, a sudden improvement may correspond to a prompt being given by the test administrator (which is why we discourage the use of prompts as they can act as an external motivator and skew the test taker’s natural performance ability).
Feedback from the test taker at the end of the test may also be helpful in understanding how much effort they put into the task. Has the test taker managed a reasonable performance, but is completely exhausted at the end of the task?
4) Parameter summary
When you have analysed the graphs, it is time to look at the parameter summary and put the Q-scores into context with the patterns you have observed.
Check the positioning of the red diamonds on the grids for each symptom domain. Are they all around the middle, suggesting a performance within the normal range, or are they shifted to the right, suggesting there are impairments within this domain? Next look at the actual Q-scores (you can turn back to Chapter 3 if a reminder of the Q-score values is helpful).
Always look out for inconsistencies within a single domain, for example if some of the Attention parameters are within the Normal, or Better than Normal range, and some are in the Atypical range.
Patterns like this should always raise a red flag, and if you are new to QbTest we would recommend seeking further guidance in interpretation through an Interpretation Support Call. Turn back to Chapter 3 if you require a reminder of the Parameter score guidance.
5) Quality Assurance
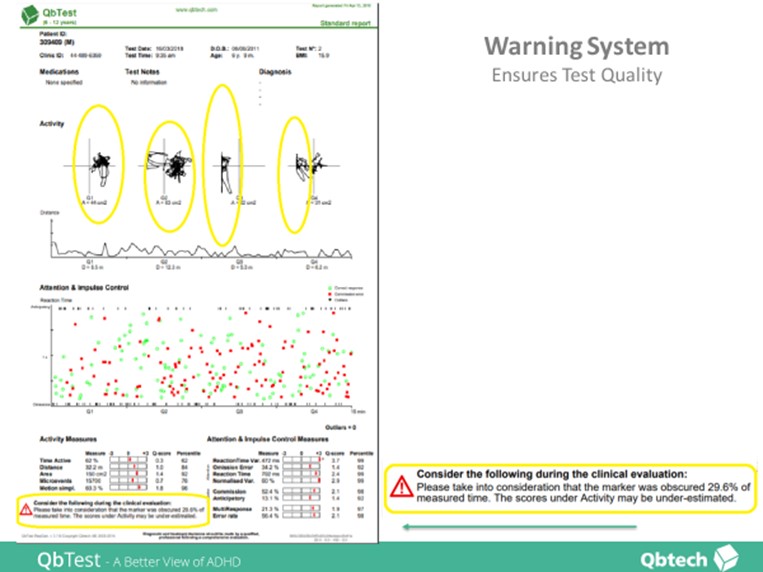
When test results have been submitted for analysis to our server, the report is automatically checked to determine if there has been any interference with the camera readings. This is part of the Quality Assurance measures of QbTest. If any problems are detected the user will be alerted by a warning text in the lower left-hand corner of the Standard Report.
There are two different types of warning you may see. Firstly, if the marker has been obscured during testing (meaning, the camera has not been able to track the movement of the reflector marker for some reason), not all of the patient’s activity will have been recorded and this might lead to an underestimation of the activity scores.
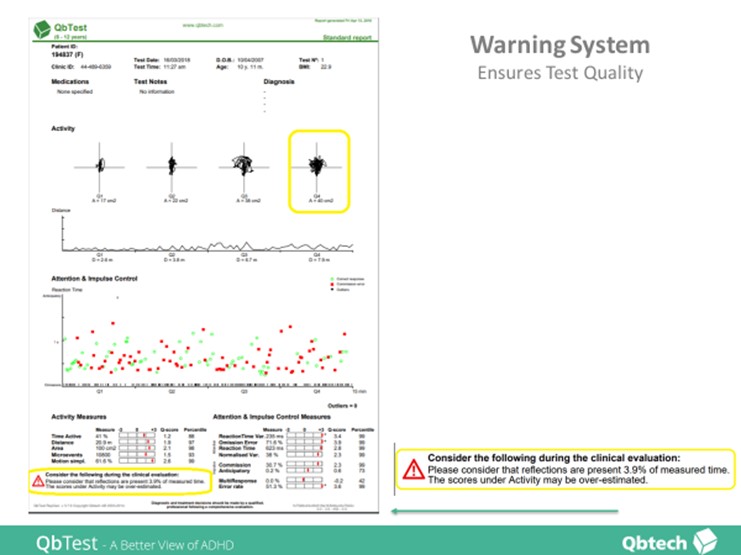
Secondly, if there have been additional sources of reflection other than the marker present during testing, this may lead to an overestimation of the activity scores.
These occurrences are unusual if you have followed the standardized procedure during administration but if you do find a warning text please contact one of the Clinical Advisors for advice.
The Detailed Assessment Report
Once you have thoroughly examined all the information on the Standard Report, you may want to turn to the Detailed Report, where you can see more detail of how your patient’s performance developed over the duration of the test.
It is also on this report that you will be able to see the Cardinal scores (Overall Q-scores) for each of the symptom domains. More information on interpreting the Detailed Report will be covered in the Intermediate Interpretation Module.
Finally…
Our objective has been to give you a basic understanding of the different outcome measures in QbTest so that you are ready to start interpreting your own QbTest reports. Please remember this course is only the beginning of your training in report interpretation. There is an additional module in Intermediate Interpretation which will build on the skills and understanding that you have developed so far.
In addition, the Clinical Advisors at Qbtech offer interpretation support calls to help clinicians who are new to QbTest, or for anyone who comes across a report that looks particularly unusual or difficult to interpret.
A Clinical Advisor will guide you on how to go about booking these calls.