3. Standard Report Overview & Q-scores
Objective
After this section, the user should understand:
What information is contained in each of the four parts on the standard report
How a patient’s performance is compared to the age and sex matched norm group, and what the different Q-score values mean
What the main differences are between the QbTest (6-12) and QbTest (12-60)
The Standard Report
The Standard Report consists of four parts:
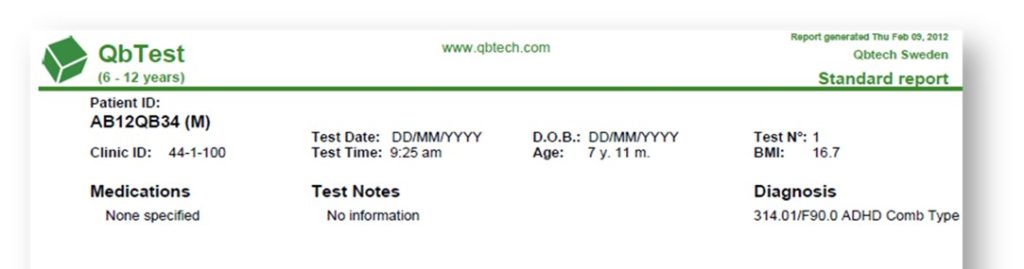
- Patient demographic data, such as age and sex, which is displayed at the top of the report
- Two activity graphs; Area and Distance, giving a visual representation of the patient’s activity during the test
- One Attention and Impulse Control graph showing the patient’s correct, incorrect, and missed responses during the QbTest
Raw and standardized scores for the different performance parameters.
1) Patient demographic data:
Age, sex, Patient ID, diagnosis, and other information that the administrator enters, is displayed on the top of report.
2) Activity Graphs:
2a) The Area graph:
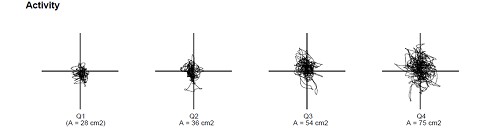
This graph consists of four crosses, each representing one quartile of the test duration. The markings shown over each cross represents the recorded path of the reflective marker and illustrates how far the patient moves in the space around them. This is shown on the graph in cm2 for each quartile.
2b) The Distance graph:
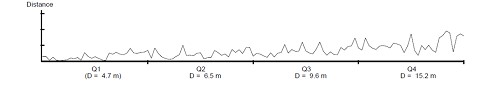
This graph shows whether the patient’s movement increases and/or decreases as the test progresses with the horizontal axis (x-axis) representing the duration of the test, and the vertical axis (y-axis) representing the distance travelled. The horizontal axis of the graph is marked off into four quartiles and the distance is shown in metres for each of these quartiles.
3) The Attention & Impulse Control graph
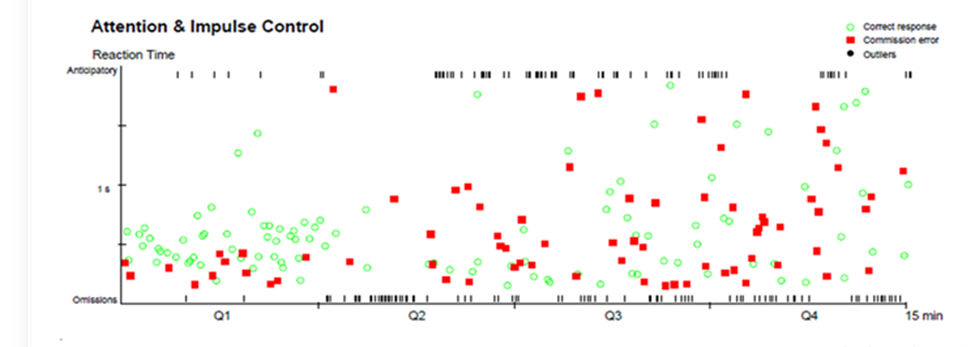
This detailed graph contains information on several aspects of attention and impulsivity. The horizontal axis (x-axis) represents the duration of the test.
The vertical axis (y-axis) shows the reaction time of each and every response, both correct and incorrect, made by the patient. Each response is plotted at a position that corresponds to the reaction time to the stimulus and the time into the test when the response was made.
You will observe the following symbols on the graph:
Green circles – these represent correct responses, i.e. the patient has correctly pressed for a target stimulus
Red squares – these represent incorrect responses, i.e. the patient has pressed for a non-target stimulus that they should have ignored. They are referred to as Commission Errors
Small black marks along the bottom of the graph – These represent ‘missed targets’ where a patient failed to respond to a target stimulus, i.e. has not pressed for the grey circle in QbTest (6-12) or when an identical symbol has repeated itself in QbTest (12-60). These are referred to as Omission Errors and are located just above the horizontal axis.
Small black marks at the very top of the graph – These are recorded when the patient presses the responder button within 150 milliseconds before or after the stimulus is shown on the screen. They are referred to as Anticipatory Errors.
4) Raw and standardized scores
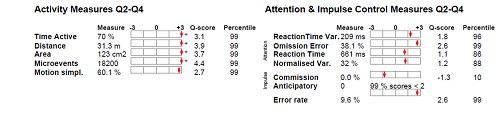
At the bottom of the report, the different performance parameters are compared to norm data and presented as raw scores (measure), Q-scores and the corresponding percentiles.
Q-Score and cut off values
The Q-scores are used for comparisons to an age and sex matched norm group and represent standard deviations from the norm data for each of the QbTest variables. Besides being displayed as a number, the Q-score is also shown as a red diamond marker in a grid. This gives an immediate visual impression of your patient’s scores, showing whether they are largely within the normal range (in the middle of the grid), in the atypical range (on the right hand side of the grid), or in the better than norm range (on the left hand side of the grid).
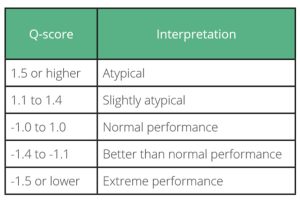
In order to compare a patient’s test performance to the age and sex matched norm group, cut-off values have been established based on clinical validation studies.
- Q-Scores:
1.5 or above should be viewed as “Atypical Performance” and indicates the patient performed significantly worse than their normative comparison group - 1 to 1.4 should be viewed as a “Slightly Atypical Performance”, indicating that the patient performed slightly worse than their normative comparison group
- -1 to 1 demonstrate that the patient has performed within “Normal Performance” range in comparison to their normative comparison group
- -1.4 to -1.1 is described as the “Better than Normal Performance “range, where the patient performed slightly better than the normative comparison group
- -1.5 and below demonstrates the “Extreme Performance” range, in which the patient has performed significantly better that their normative comparison group.
Please note that these cut-offs shall only be used in combination with other clinical and medical considerations.
Key differences between QbTest (6-12) and QbTest (12-60) reports
- Time: QbTest (6-12) lasts 15 minutes, whereas QbTest (12-60) lasts 20 minutes.
- Complexity: QbTest (6-12) is a simple ‘go/no-go’ task that measures a patient’s sustained attention by how he responds to the stimulus he sees on the screen for the duration of the test. The (12-60) version involves both sustained and selective attention, where the patient has to make a decision based on whether to respond or not, by comparing the symbol the on-screen symbol to one immediately preceding it, for the duration of the task
- Ratio of targets to non-targets: in QbTest (6-12) 50% of symbols require a response, whereas in the (12-60) task 25% of the symbols are targets
- Q-score calculation: for QbTest (6-12) the Q-scores on the Standard Report are based on the entire 15-minute performance. On QbTest (12-60) the first 5 minutes are allowed as a period of adaptation to the task, and only the last 15 minutes (Q2 – Q4) are used to calculate the Q-scores.