5. Attention & Impulse Control Parameters
Objective:
At the end of this section the user should be able to describe the three key parameters for attention and the two impulsivity parameters.
The Attention parameters in the standard report
There are 5 attention parameters in the standard report. The three key parameters of Reaction Time, Omission Errors and Reaction Time Variation are discussed below. Information on Outliers and Normalised Variation can be found in the Intermediate Interpretation Training.
1) Reaction Time
Reaction Time is the average time it takes for the patient to correctly respond to the targets, as they are presented on the screen, and is measured in milliseconds. This parameter reflects processing and execution.
2) Reaction Time Variation
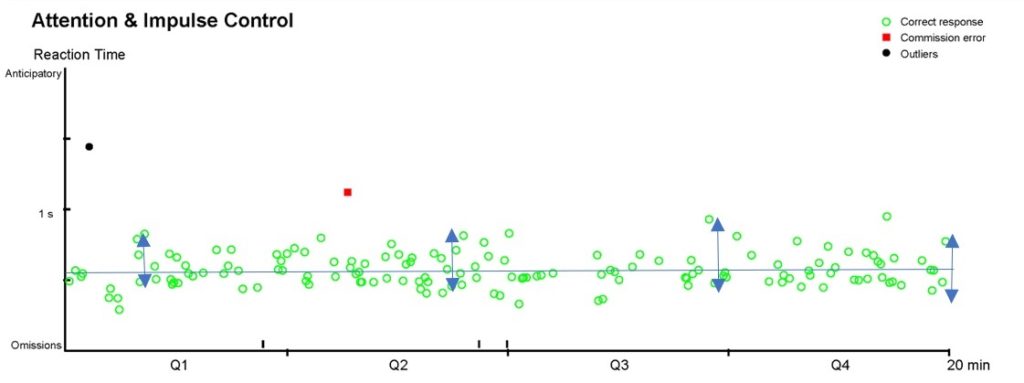
Reaction Time variation is the standard deviation of Reaction Time, and measures how consistent a patient’s response time is over the duration of the test. A high Reaction Time Variation Q-score indicates that the patient will sometimes respond very quickly to targets and other times very slowly, and the green correct responses will be very spread out from the bottom to the top of the graph.
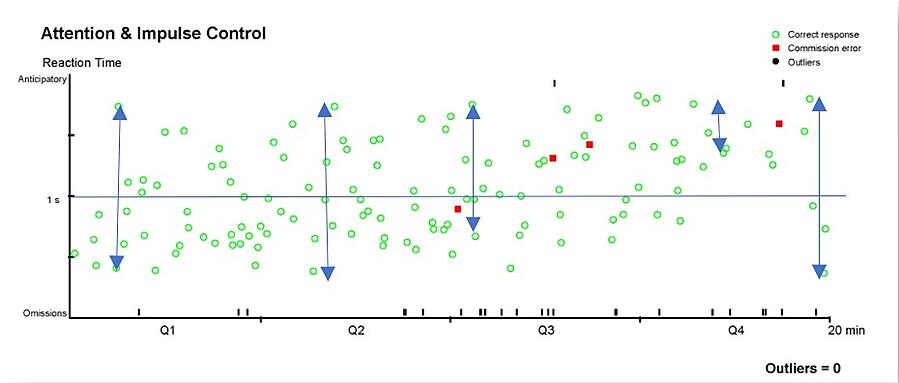
Patients who score within the normal range for Reaction Time variation will generally respond to all target stimuli at about the same speed, and the green circles will be tightly packed together.
High Reaction Time variation scores may reflect clinical difficulties with sustaining and/or regulating attention, and this is the most sensitive attention parameter for QbTest (6-12).
3) Omission Errors
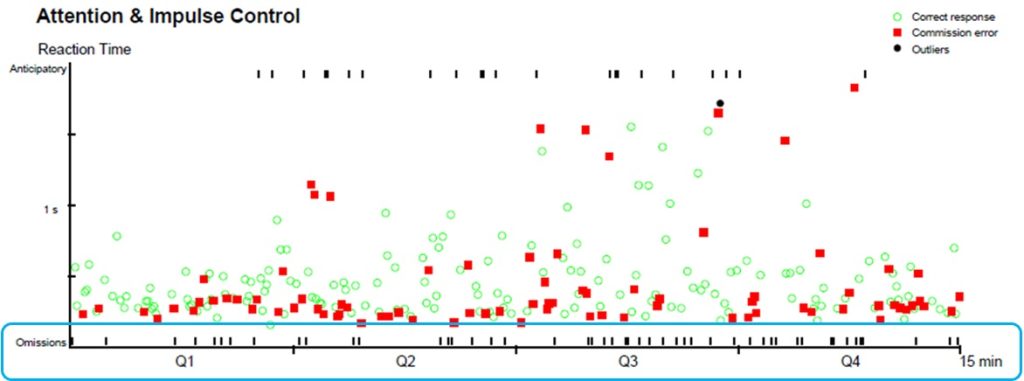
These occur when no response is registered to a Target stimulus, that is, the patient did not press the response button when a Target stimulus was shown on the screen. This usually reflects attention lapses and distractibility. The omission errors are shown on the Attention and Impulse Control graph as black marks just above the x-axis.
The Impulsivity parameters in the Standard report
There are two parameters for impulsivity.
1) Commission Errors
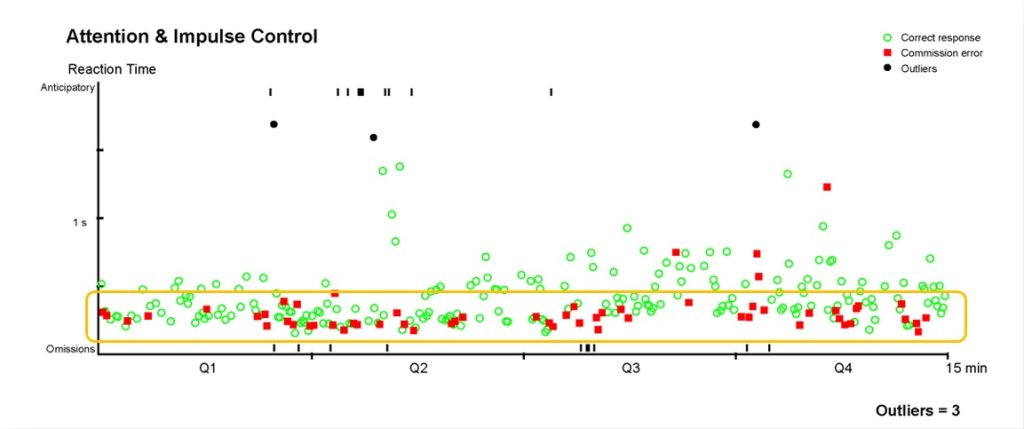
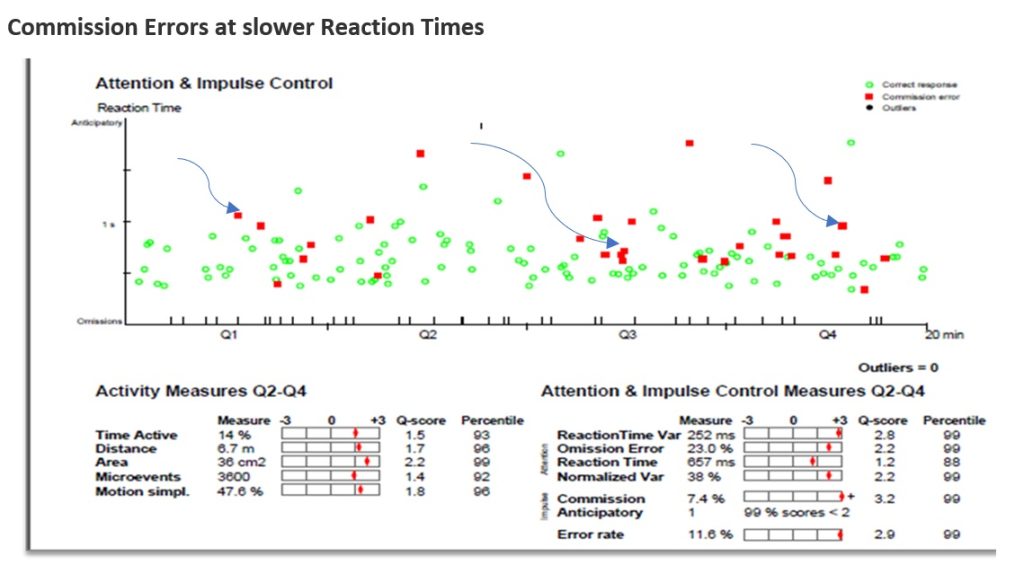
This type of error occurs when a response is registered to a Non-target, that is, the patient pressed the button in response to a stimuli when they should not have pressed. Commission Errors indicate impulsive behavior and are believed to result from the anticipatory or incomplete processing of the stimulus.
The commission errors are plotted as red squares on the Attention & Impulse Control graph. On QbTest (6-12) Commission Errors usually occur at high speeds as the patient is unable to inhibit their response for long enough to consider whether the shape on screen is a Target or Non-target. Responses occurring at higher speeds can be seen lower (in relation to the y-axis) on the Attention and Impulse Control Graph.
In QbTest (12-60), Commission Errors are less common, and when they do occur may be seen spread across the graph, occurring at different response times. These usually occur when the patient is unsure whether the stimulus is a target or non-target, due to incomplete processing of the visual information.
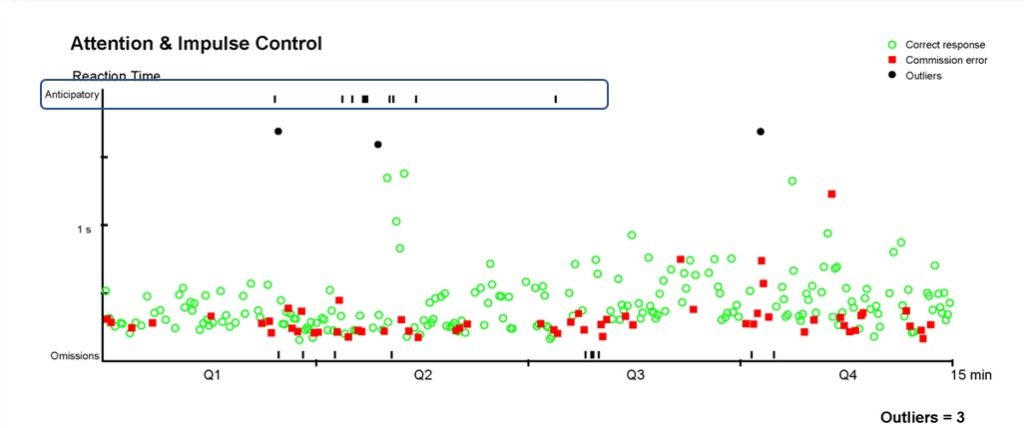
2) Anticipatory Errors
This type of error occurs when a response is detected just before or just after a stimulus is presented on the screen. Anticipatory Errors may constitute “guesses” as indicated by a reaction time of less than 150 milliseconds before or after the stimulus, which is faster than neuromuscular transmission capability. You usually need between 200-300 milliseconds in order to process a stimulus and make an informed decision on how to respond. Thus, the patient is anticipating Targets rather than responding to the stimuli.
Anticipatory Errors are considered to indicate impulsivity, but may also be caused by poor rule-governing behavior to the task, i.e. the patient is not doing what you asked him to do. High levels of Anticipatory Errors may also occur if the patient has not understood the test instructions properly and believes that he must respond before the stimuli disappear. In instances of extremely slow reaction time, a patient’s extremely delayed response to a stimulus may be recorded as an Anticipatory Error response to the next stimulus.
Single Anticipatory Errors are more likely to indicate impulsivity. Clusters of this type of error may be due to repeated clicking of the responder button and may indicate poor on-task behavior, lack of compliance, lack of understanding or impulsivity within the context of the patient’s performance in other aspects/parameters of the test.
Adolescents and adults rarely make Anticipatory Errors. In the norm group 99% of the participants made 2 or less Anticipatory Errors, therefore this parameter is provided as a raw score and not as a standardized score compared to norm in QbTest (12-60).
Two additional parameters
There are two more parameters available in the Standard report: MultiResponse and Error Rate. The MultiResponse parameter is only reported in the child version of the test. A MultiResponse event is registered when more than one button press is detected per stimulus presented.
Responding more than once to the same stimulus may have different origins. In some cases, it may reflect hyper-responsiveness or in other cases random responding.
The last parameter that is reported in the Standard report is the Error Rate which is a measure of the overall accuracy and shows how often the patient has responded incorrectly (including both Omission and Commission). It is a validity measure where very high Error Rate might reflect a misunderstanding of the task.