3. The Retest/Treatment Report – Clinic
When a patient has undergone more than one QbTest, two other reports are available. The Retest Report – Clinic (sometimes referred to as the Treatment report) facilitates the comparison of two test results when a test taker has completed multiple QbTests and is only available if two or more tests have been performed.
The Treatment report contains the parameter scores from both the Standard and Detailed Reports divided into the 3 core symptom areas (activity, attention and impulsivity) as measured by the QbTest. Starting with activity; the area graphs are provided for both the first and second half of Test 1 and Test 2. A bar graph shows the 5 activity parameter Q-scores that also are used in the Standard Report.
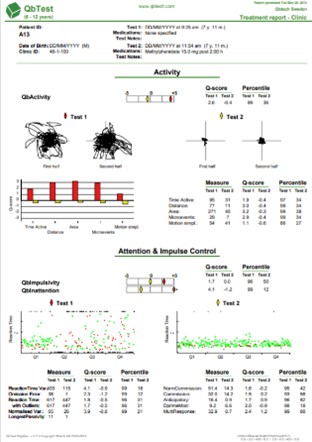
To facilitate the comparison between Test 1 and Test 2, the data is colour coded. Red indicates the results for Test 1, and yellow for Test 2. For all three symptom areas you will also find the composite score – the cardinal parameters that are described in the Detailed report section (Chapter 1) of this module, as well as raw scores (under the heading Measures), Q-scores and percentiles.
There are many different ways to use Retest reports. Many clinicians compare the initial baseline test (the first test completed when undergoing the initial ADHD assessment), to the test taker’s performance after initiating treatment to see if medication (or other treatment) has had an effect.
Some clinicians use QbTest while titrating medication to assess when an optimal dose is achieved. Others will use the Retest reports to compare the efficacy of different types of medications for an individual, or even compare different doses of the same type of medication to determine an optimal dosage.