1. The Detailed Assessment Report – Clinic
The objective of this section is to review the Detailed report and understand the similarities and differences compared to the Standard report (which was covered in the Basic Interpretation module). This section will also explain the additional parameters in the Detailed report.
At the top of the Detailed report, you can find the patient’s demographic information (e.g. Patient ID, date of birth, age, sex etc.), as well as other information such as date and time of test, medication, and test notes.
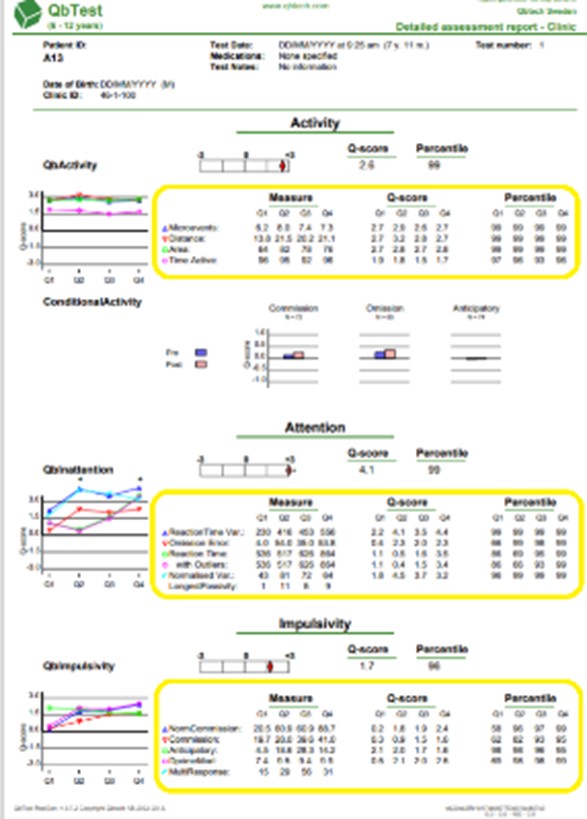
The Detailed report is divided into 3 sections, each covering one of the cardinal symptom domains: Activity, Attention and Impulsivity. The results for each symptom domain are displayed in three ways:
- A cardinal parameter, which is a composite score
- Raw score, Q-score and percentile for each individual parameter shown per quartile
- A graph with individual parameter Q-scores for each quarter
In the Activity domain only, there are 3 additional bar graphs which will be explained in the Additional Parameters section later in this section.
1) The Cardinal Parameters
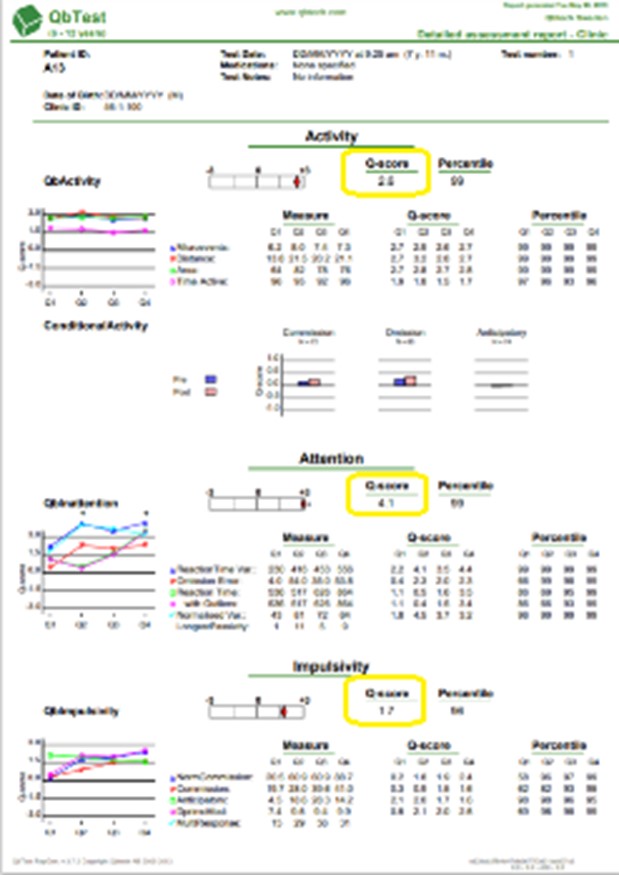
Each cardinal parameter Q-score) is found at the top of each section (titled Activity, Attention, and Impulsivity).
The cardinal parameters are used to assist clinicians in understanding how the test taker’s performance in each of the ADHD core symptom domains (activity, attention and impulsivity) compares to the age and sex-matched normative group. Each cardinal Q-score is made up of the weighted individual parameters that are most strongly related to each other in each symptom domain. More information about how the cardinal parameters are calculated can be found in the Cardinal Parameters section of the QbTest Technical Manual.
These cardinal scores reflect the test-taker’s performance on the last two quartiles (Q3 and Q4) for Activity and Attention, and the last three quartiles (Q2, Q3 & Q4) for Impulsivity.
2) Individual Parameters within each Symptom Domain
The second way the results within a domain are displayed is as individual parameters. Each parameter within the symptom area is divided into 4 quartiles so that you can evaluate the test taker’s performance over time.
This allows the interpreter to assess the test taker’s profile in detail over time for each parameter, and determine whether performance improved, deteriorated, remained constant, or fluctuated over time. Data is displayed as raw scores (“Measures”), Q-scores and percentiles, just as the Standard report.
3) Graph
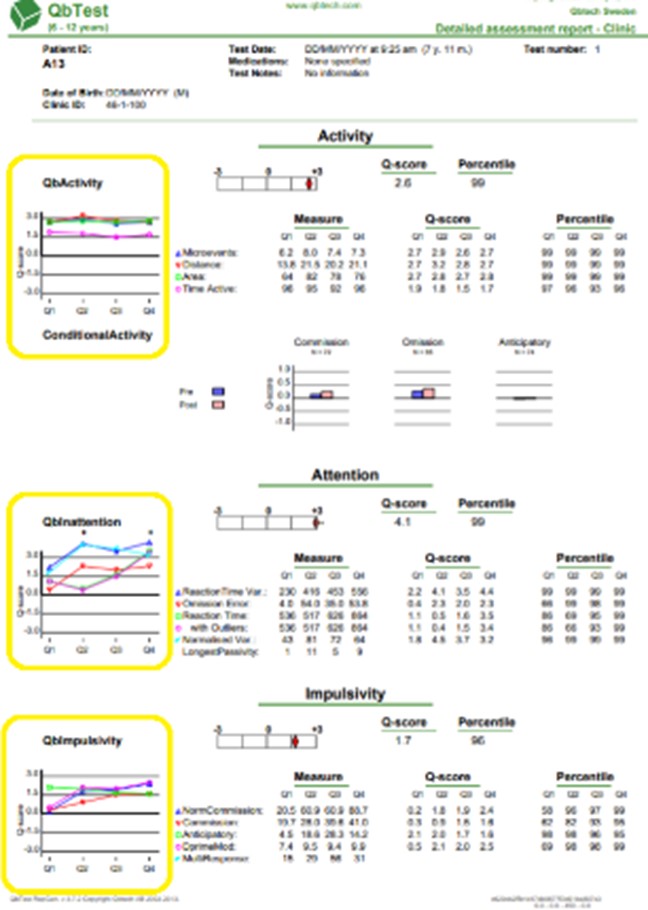
On the left side of the report, the test taker’s results are displayed graphically, where each individual parameter is colour coded. The graphs show each parameter using Q-scores and on a line graph, and illustrates how the performance patterns develop over time across each quartile.
This is particularly useful for determining consistencies and discrepancies between parameters within a domain, as well as between the core domains.
Additional Parameters
In the Detailed Report there are 8 additional parameters that we will review in this chapter.
A. Activity Parameters:
- Microevents
- Time Active
- Conditional Activity
B. Attention Parameters:
- Reaction Time with Outliers
- Normalized Variation
- Longest Passivity
C. Impulsivity Parameters:
- Norm Commission
- DPrime Mod
- Multiresponse
1. Activity Parameters:
a. Microevents
Microevents are the very small, subtle movements measured by the infrared camera during QbTest. This parameter measures the number of occasions when the marker changes its position more than one millimeter since the last Microevent. A large number of Microevents indicates a high degree of activity via smaller movements that may not be easily observed.
b. Time Active
Time Active is the percentage of seconds during the test that the test taker had a movement more than 1 centimeter. This parameter excludes subtle movements such as breathing.
c. Conditional Activity
There are 3 bar graphs in the Activity section of the Detailed Assessment report. These bar graphs show the mean activity (distance) of the test taker during the 2 seconds immediately before and immediately after the following incorrect responses registered on the CPT part of QbTest:
Commission Error – The test taker pressed the responder button in response to a Non-Target that should have been ignored.
Omission Error – The patient did not press the responder button in response to a Target that should have been responded to.
Anticipatory Error – The test taker responded too soon (<150 milliseconds) before or after a stimulus (either Target or Non-Target) was displayed, indicating that the patient responded before processing whether the symbol was a Target or not.
These parameters provide additional information for interpretation of test results. For example, test takers with increased activity immediately after Commission errors may have realized the error.
As another example, a test taker with increased activity before and after Omission Errors may indicate that they were distracted or not attending to the screen.
These graphs are qualitative and must be interpreted in conjunction with the Behavioural Observation form. They will not alter the Cardinal parameterQ-scores), but can provide insight to the test taker’s performance, such as how aware they may be of their impulsive difficulties, for example. It is important to know that Conditional Activity scores take into account each test taker’s activity during their correct responses.
2. Attention Parameters:
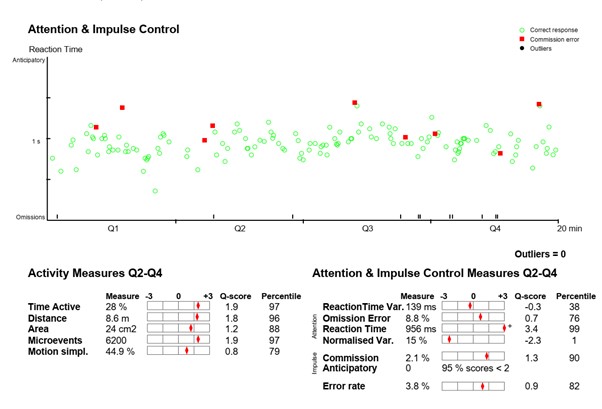
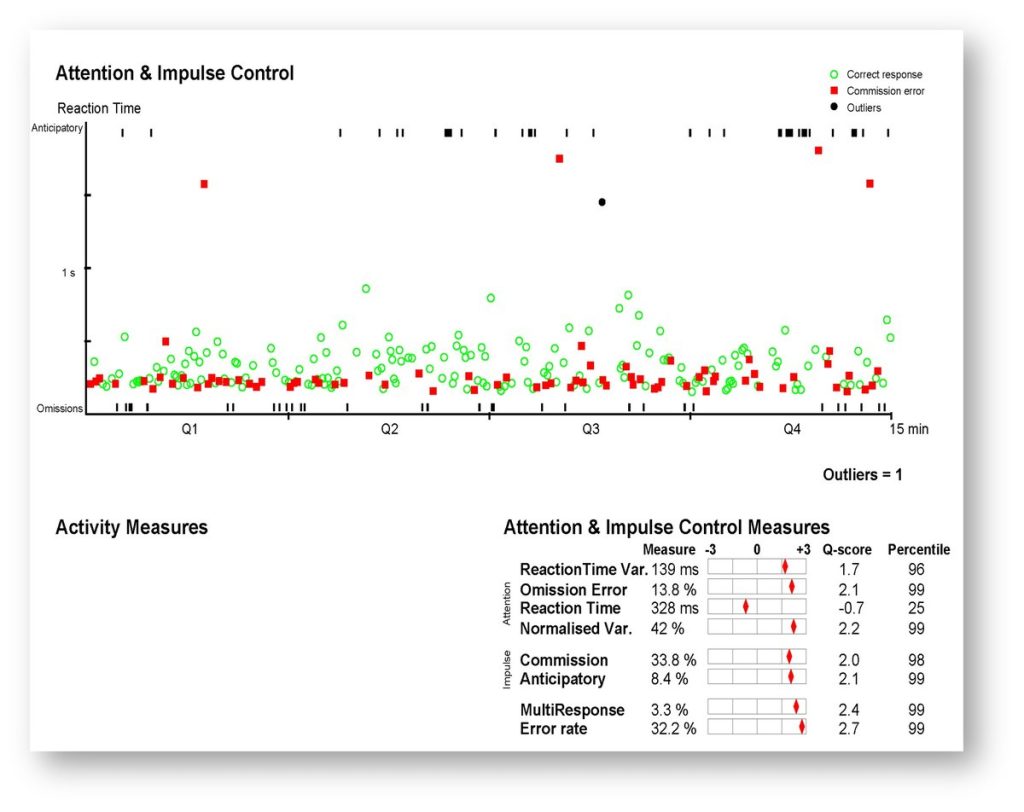
a) Reaction Time with Outliers:
Outliers are Reaction Time scores that are very slow compared to the overall reaction time performance during the test. These scores are not included when calculating the mean Reaction Time since scores that are clearly outside the response pattern will skew the overall mean and standard deviation of the Reaction Time and also affect the Reaction Time Variation score.
In the Standard report the Outliers are only shown in the CPT graph (as black circles) but not included in the score summary. In the Detailed report, however, you will find the Reaction Time displayed both with (purple circle) and without (green square) the Outliers. When these 2 scores are quite similar, there are minimal Outlier in the test taker’s reaction times.
b) Normalized Variation:
This parameter validates the relationship between Reaction Time and Reaction Time Variation. Normalized Variation scores will be elevated when the relative difference between Reaction Time and Reaction Time Variation is high – this may indicate inattentiveness but should be interpreted with caution and within context.
Simply put, we would expect someone who is paying attention to be quick in their responses (Reaction Time) and consistent (Reaction Time Variation). Likewise, someone who is inattentive may be slower to respond and/or less consistent in their time to react to a stimuli.
Let’s use two examples of very different profiles that may result in elevated Normalized Variation scores:
- Example 1: Slow Reaction Time and normal Reaction Time Variation
- Example 2: Fast Reaction Time and poor Reaction Time Variation
Example 1
The result in Example 1 profile shows a slow Reaction Time (a high Q-score) and normal Reaction Time Variation (Q-score close to 0) – indicating there is a discrepancy between the two parameters as one is in the Atypical Range (Reaction Time) and one is in the Normal Range (Reaction Time Variation).
This discrepancy would result in Normalized Variation falling in the Extreme Performance range (a lower than average Q-score). You should consider the accuracy of the patient’s performance in relation to commission, omission and anticipatory errors and interpret with caution what that means for the individual.
One pattern is that slow reaction times are accompanied by fluctuating reaction times (variation). However, in this case, the patient is slow to respond, but consistently slow. Therefore, the discrepancy in in Example 1 represents a consistently (Reaction Time Variation in average range) yet slow (Reaction Time Q-score is high) reaction style during the test.
Example 2
The result in Example 2 shows a fast Reaction Time (a low Q-score) and a poor score for Reaction Time Variation (a high Q-score). Again, the discrepancy in these two scores would result in an elevated score on Normalized Variation. Many times, it may be expected that someone who responds quickly also responds at a consistently fast rate, but this is not the case in this specific example. In Example 2, the test taker exhibits fast, yet inconsistent response pattern. Again, you should consider other parameters when evaluating performance as this could indicate Inattentiveness and/or impulsivity.
c) Longest passivity
This parameter reports the highest number of consecutive Omission Errors that occurred within a quartile. The software starts counting from the first Omission Error and is terminated by any button response, regardless if the response is correct or incorrect. The Longest Passivity count is not terminated by correctly rejecting (not responding to) Non-Target stimuli.
This parameter is not standardized and should be interpreted in the context of observations of the test-taker made by the Test Administrator. It is a raw score measure that lets the interpreter know how many stimuli (Targets and/or Non-Targets) in a row were presented and not responded to by the test taker.
Impulsivity Parameters:
a) Norm Commission
Norm Commission is an indicator of impulsive performance that takes into account the relationship between commission errors and omission errors. A general trend of performance is that impulsive responding (e.g. commissions) decreases as inattentiveness (e.g. omissions) increases.
That is, if a test taker is inattentive and fails to respond to target stimuli (omissions), they may also respond to non-targets impulsively (commissions) less often.
Norm Commission adjusts and compensates for the rate of inattention by calculating the percentage of commission errors made in proportion to all non-targets presented, as well as how many omission errors have been made.
This may help reduce the risk of false negative results on impulsivity when the response rate to Targets is low, as a low level of responding would reduce the opportunities for commission errors. The percentage of impulsive commission errors alone may be less sensitive to underlying impulsivity symptoms if the test taker also has a low response rate to Targets due to inattention.
b) DPrimeMod
DprimeMod is based on the Signal Detection Theory – that is, the ability to discriminate signal from noise. This parameter reflects the test taker’s ability to accurately detect targets (signal) that they should respond to amongst the non-targets (noise). It is considered as a measure of the test takers sensitivity to the stimuli, which includes aspects of perception and attention. A high score indicates that Targets are difficult to differentiate from Non-targets.