2. The Patient Assessment Report
In this chapter we will cover the Assessment Report-Patient and highlight its uses for feedback with test takers and their families.
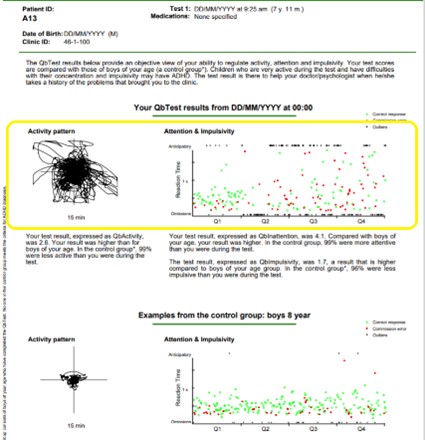
The Patient Report presents the test taker’s QbTest results in 3 different ways:
- Visual graphs
- Q-scores and percentiles
- Written descriptions
The 2 graphs at the top of the page are visual representations of the test taker’s total activity level (as shown by the Area graph to the left) and their performance on the CPT (as shown by the Attention and Impulsivity graph on the right).
The graphs at the bottom of the page are examples of QbTest results in the areas of activity, attention and impulsivity for a person in the comparison group. The comparison group consists of age- and sex- matched individuals who completed the QbTest and did not meet criteria for ADHD diagnosis.
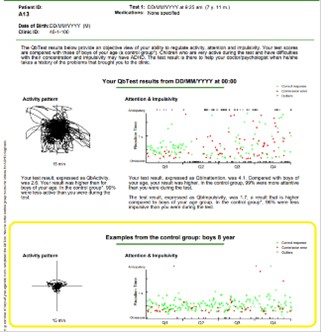
This is provided as a visual aid to see their performance on an objective measure and compare their results to others in the normative group.
In the middle of the page, results are reported in text with Q-scores and percentiles, as well as descriptions interpreting how their performance on the QbTest compares to those in their normative comparison group (e.g. whether their performance indicates that they were more, less or about the same in activity, attention, and impulsivity relative to others their age without a diagnosis of ADHD).
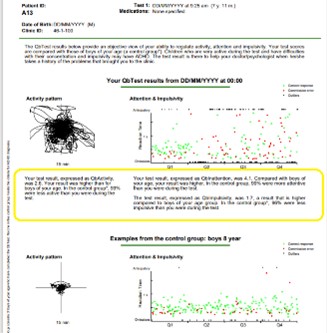
There is a warning at the bottom of the page, informing the patient that the QbTest results should be interpreted by a qualified professional and used as part of a comprehensive evaluation. A QbTest report should never be used as a stand-alone, diagnostic tool.